
Skip to content
Profit Recovery Review
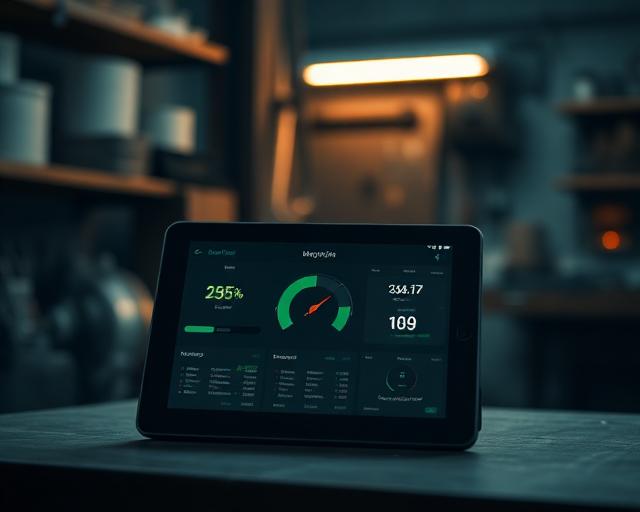
Site supervisor reviewing live job cost and margin figures on a tablet on site.

Where the money actually goes 05 — page 5 of 8

Live Job Profit

If you can’t see profit while the job is happening, you can’t protect it.

The quote told you what the job should make. The field tells you what it is actually costing. Live Job Profit connects the two while the work is still happening — so you can see current margin, costs, hours and charge-out before the job is over.

  • See job profit in real time

    Know what each active job is earning while the work is still live.

  • Catch problems early

    See hour and cost overruns before the week or the job is gone.

  • Compare cost vs charge-out

    Know whether the work is paying at the rate you sold it.

  • Make better calls

    Move labour, change sequence or investigate extras while the outcome can still change.

The 30-second answer

A contractor can see live job profit by comparing the accepted quote benchmark to current actual hours and true costs by job and task, including charge-out and budget usage, while the work is still underway instead of waiting for month-end.

The numbers update every 60 seconds, giving the owner and operations team a current view of whether the job is still protecting the profit that was quoted. Live Job Profit tells you where the job is now; Profit Drift tells you whether it is moving away from the quote.

What it looks like, what it costs, and why it keeps happening

Does this sound familiar?

  • The job looked good last week, but nobody trusts the number this week.
  • Billing is going out, but you still cannot say what the job is actually keeping.
  • The crew is busy and payroll is getting paid, but margin keeps sliding.
  • You only get the real job-cost number after payroll, accounting or month-end.
  • A task burns through its hours and nobody notices until the work is already finished.
  • Extra work happens, but its cost is mixed into the original job until someone sorts it out later.

This is what it’s costing you

  • One $1,250,000 job
  • × 2 margin points lost before anyone reacts

$25,000

$1,250,000 × 2% = $25,000 of quoted profit gone on one job. Illustrative margin-loss example, not a guaranteed recovery claim.

Why the usual way fails

  • Accounting tells you what posted — not what the live job is doing right now.
  • Spreadsheets require somebody to rebuild the same comparison again and again.
  • The quote is stored separately from field time and current cost.
  • Supervisors know the work is slipping before the office numbers show it.
  • By the time a monthly report confirms the issue, the labour has already been paid.

Why it keeps happening

The estimate and the actual execution never meet on one current screen.

  • The true labour cost was never built correctly.
  • The job was not quoted from a common task structure and benchmark.
  • Field hours are not tied cleanly to the same jobs and tasks that were quoted.
  • Materials, expenses and third-party costs arrive in different places and at different times.
  • Extra work is not separated quickly enough.

You cannot fix what you cannot see while it is happening.

The PPS + PWP way to see job profit before the job is over

Profit Pulse System builds the engine. ProjectWatchPRO automates the work.

How to fix it

  1. Calculate true overhead and labour cost first.
  2. Build task-specific costs so the work is measured at the same level it was planned.
  3. Quote the job from true cost, hours by task and the margin you intend to keep.
  4. Use the accepted quote as the benchmark for the live project.
  5. Capture actual time to the right job and task as the work happens.
  6. Bring current labour, materials, expenses and third-party cost into the project.
  7. Compare actual cost and hours to the quoted benchmark throughout the day and week.
  8. Act while labour and work remain — not after the job has already closed.

The 9 steps of Profit Pulse System

  1. 1Overhead Guru
  2. 2Labor Analyst
  3. 3Burden Builder
  4. 4Task Architect
  5. 5Bulletproof Quote
  6. 6Schedule Master
  7. 7Pulse Monitor
  8. 8Drift Detector
  9. 9Profit Pulse Loop

Used to build profit defense. Orange steps are the ones this page depends on.

Step 1 — Overhead Guru
Provides the real overhead cost that must be carried by productive work.
Step 2 — Labor Analyst
Provides employee labour cost and quoting LBR logic.
Step 3 — Burden Builder
Adds the task-specific cost layers.
Step 4 — Task Architect
Creates the task and cost-code structure used by quote and actual execution.
Step 5 — Bulletproof Quote
Creates the economic benchmark: hours, cost, charge-out and intended margin.
Step 7 — Pulse Monitor
Connects actual live execution to that benchmark while the project is open.

ProjectWatchPRO gives you

  • Estimated margin vs current margin.
  • Profit to date and current project economics.
  • Projected margin where supported by the current dashboard.
  • Costs vs budget.
  • Actual true cost vs charge-out.
  • Hours and cost by job and task or cost code.
  • A current view of which jobs and tasks are using more hours or dollars than expected.
  • One live project view refreshed every 60 seconds.

What gets better when you fix this

  • You know which active jobs are paying and which are leaking.
  • Cost and hour problems get investigated while they can still be changed.
  • Foremen, operations and ownership work from the same current numbers.
  • You stop waiting for month-end to learn what happened.
  • You can make better calls on labour, sequence, extra work and billing.
  • More of the margin you quoted has a chance to survive the job.

What you actually see

Live job margin, while the job is still running

Where live job profit shows up in the day-to-day view: quoted margin, margin right now, and the hours behind the number. Representative view.

Benchmark → execution → current margin

The accepted quote sets the standard. Actual execution is costed with the real employee’s labour logic and compared back to it.

  1. Quote benchmark

    Planned task hours and approved quote-cost assumptions, including company-average LBR.

  2. Actual execution

    Real employee time costed with that employee’s individual labour burden.

  3. Hours compared

    Quoted hours vs actual hours by job and task.

  4. Dollars compared

    Quoted dollars vs actual dollars on the same structure.

  5. Budget used

    Budget and hours used where exposed in the production screens.

  6. Cost vs charge-out

    Actual true cost measured against what the work is charged at.

  7. Current margin

    Estimated margin vs current margin, refreshed every 60 seconds.

Startable work

What the live numbers mean

The point is not more reporting. It is seeing the job while labour and work still remain to be managed.

  • The accepted quote stays the benchmark — actual employee rates never overwrite quote-standard values.
  • Extra work stays visible as a linked sub-project so it does not muddy the original job economics.
  • Current variance is shown as visibility, not as an automated alert or prediction.
  • The project dashboard refreshes every 60 seconds so the view matches the work in progress.

How much longer can you afford to wait?

  1. Next 30 days~$8,300
  2. Next 60 days~$16,700
  3. Next 90 days~$25,000

Illustrative pace of the $25,000 margin leak across a 90-day job. Margin loss is not assumed to occur linearly on every job. Figures are illustrative examples, not documented client results. We replace them with your numbers during the Profit Recovery Review.

Questions owners ask

Can you see job profit before the job is finished?

Yes. With true cost, task hours and captured field time in place, estimated margin can be compared with current margin while the work is still live.

What is real-time job costing for contractors?

Job cost that updates from field time and committed costs as the work happens, rather than being assembled after closeout when nothing can be changed.

How often does the live margin update?

The live job view refreshes about every 60 seconds, so the number in front of you reflects the hours and costs recorded so far today.

What should an owner look at first?

Estimated margin versus current margin, then hours used versus hours quoted on the tasks driving the gap.

Let’s put your live jobs back on track.

We’ll show you which numbers you need to see while the job is live, where the margin is leaking, and what you can still change before the work is finished.

Live Job Profit tells you where the job is now. The next question is whether the margin is holding — or moving away from the quote.